


Table of Contents
Implementing Gantt charts can significantly enhance project management by providing a clear visual timeline for tasks, deadlines, and milestones. This tool allows project managers to plan, coordinate, and track the progress of projects more efficiently. However, many project managers encounter challenges when trying to make the most of this powerful tool.
In this article, we will explore the fundamental aspects of the Gantt chart, common challenges in implementing the Gantt chart, and tips and tricks to overcome them.
Understanding Gantt Chart
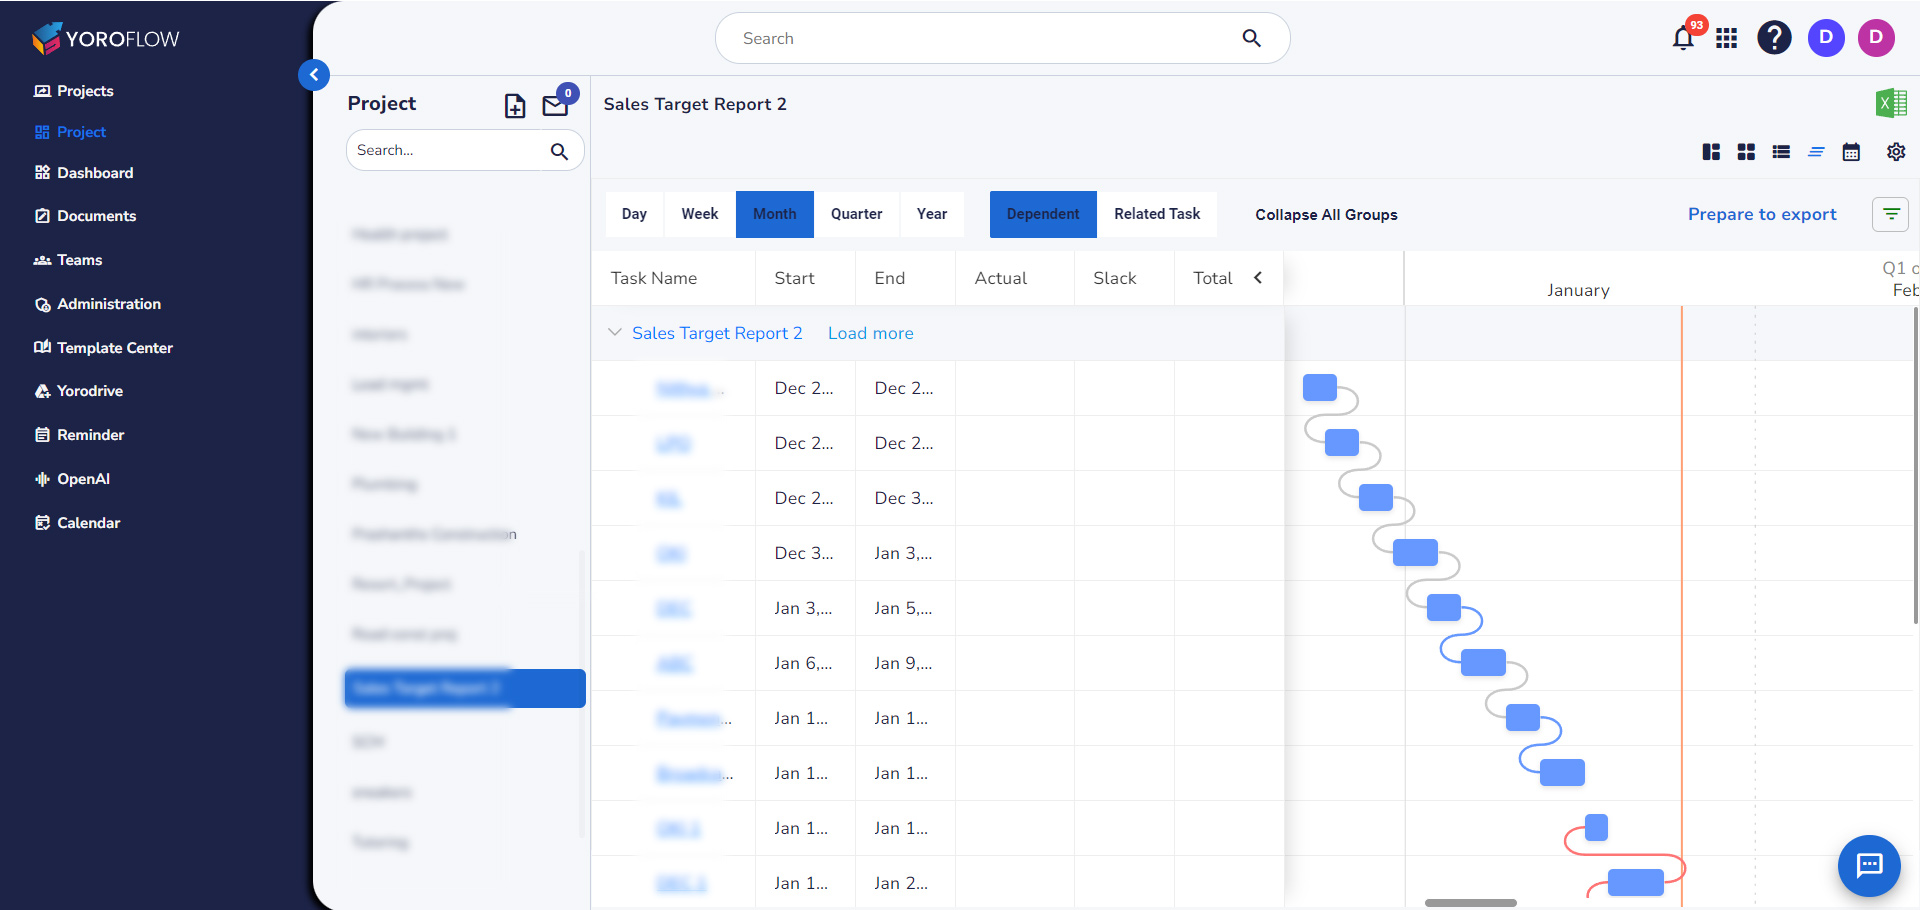
Understanding Gantt charts is crucial for effective project management. A Gantt chart is a visual tool that helps in enhancing time management and task management by outlining the timeline of a project, displaying tasks, their durations, and their dependencies. Each task is represented as a horizontal bar, with its length corresponding to the task’s duration. This format makes it easy to see the start and end dates of each task, identify overlapping activities, and understand task dependencies.
Project management tools like Yoroproject offer a Gantt view for task management. By providing a clear overview of project timelines, Gantt charts help project managers allocate resources, manage deadlines, and track progress. They are especially useful for identifying potential bottlenecks and ensuring that all team members are aligned with the project schedule.
In the digital working environment, project management software like Yoroproject integrates Kanban methodology to enhance efficiency. This feature provides task cards, columns indicating different project stages, and a clear real-time overview of each task. This Kanban board helps the team to enhance the transparency and efficiency of the project.
Basic components of the Gantt chart
The basic components of a Gantt chart include:
- Tasks or Activities: These are the specific activities or tasks that need to be completed as part of the project. Each task is listed vertically on the left side of the chart.
- Timeline: The horizontal axis represents the project timeline, typically divided into days, weeks, or months, depending on the project duration.
- Bars: Each task is represented by a horizontal bar on the chart. The position of the bar along the timeline indicates the start and end dates of the task.
- Duration: The length of each bar corresponds to the duration of the task. Longer bars represent longer durations, while shorter bars represent shorter durations.
- Task dependencies: Arrows or lines between tasks indicate dependencies, showing which tasks must be completed before others can start. This helps visualize the sequence of tasks and their relationships.
- Milestones: Significant points or achievements in the project are often marked with milestone symbols on the Gantt chart. Milestones represent key events or goals that mark progress in the project.
- Resource Allocation: Some Gantt charts also include resource allocation, showing which resources (such as manpower or equipment) are assigned to each task and when.
Common challenges in implementing the Gantt chart
Implementing Gantt charts, while beneficial, can present several challenges:
- Complexity in setup: Setting up a Gantt view requires identifying tasks, estimating durations, and establishing dependencies, which can be time-consuming and prone to errors.
- Resource allocation: Ensuring that resources are appropriately allocated across tasks without overloading or underutilizing them can be challenging.
- Managing changes: Projects often undergo changes in scope, timelines, or resources, requiring constant updates to the Gantt chart to reflect these changes accurately.
- Dependency management: Tracking dependencies between tasks accurately to avoid delays or disruptions in the project timeline can be complex, especially in projects with intricate workflows.
- Team collaboration: Ensuring all team members understand and adhere to the Gantt chart timeline and updates requires effective communication and collaboration.
Tips and tricks for implementing Gantt chart
Here are some tips and tricks for effectively using Gantt charts:
- Plan thoroughly: Spend time upfront to outline all tasks, project milestones, and dependencies before creating the Gantt chart.
- Use software: Utilize project management software that supports Gantt charts for easier creation, management, and collaboration.
- Keep it simple: Avoid overcrowding the Gantt chart with too much detail. Focus on key tasks and milestones to maintain clarity.
- Update regularly: Continuously update the Gantt chart as tasks are completed or as project timelines change. This keeps everyone informed of progress.
- Highlight critical path: Identify and highlight the critical path—the sequence of tasks that determines the project’s overall duration—to prioritize activities.
- Manage dependencies: Clearly define task dependencies and understand how changes in one task affect others to avoid delays.
- Allocate resources: Assign resources (such as people, equipment, and budget) to tasks and monitor their availability and utilization.
- Communicate clearly: Use the Gantt chart as a communication tool to ensure all team members understand their roles, responsibilities, and deadlines.
- Monitor progress: Regularly review the Gantt chart with the team to track progress, identify bottlenecks, and adjust timelines or resources as needed.
- Stay flexible: Be prepared to adapt the Gantt chart as project conditions change, allowing for adjustments in scheduling and resource allocation.
Implement your Gantt chart tool
The Gantt chart tool within Yoroproject offers a robust solution for project managers seeking clarity, efficiency, and control in their project planning and execution. By visualizing tasks, timelines, dependencies, and milestones in a user-friendly interface, Yoroproject empowers teams to streamline collaboration, allocate resources effectively, and track progress with precision. Whether managing small tasks or complex projects, Yoroproject’s Gantt chart tool provides the flexibility and insight needed to navigate challenges, adapt to changes, and ultimately achieve project success. Embrace the power of Yoroproject’s Gantt chart software to enhance your project management capabilities and drive towards your goals with confidence.