


Table of Contents
There are several project management tools available to help you plan, manage, and track your projects. While Gantt charts are frequently discussed, it’s important not to overlook the effectiveness of kanban boards. When comparing Gantt charts and kanban boards, you’ll discover that both offer valuable contributions to your project in distinct ways.
Let’s delve into the differences between kanban and Gantt charts to explain what each tool is, provide an example illustrating how they function, and outline their respective pros and cons. Additionally, we’ll conduct a side-by-side comparison of Gantt charts and kanban boards, and offer a few free templates so you can experiment with both and determine which best suits your project management needs.
What Is a Gantt Chart?
A Gantt chart is a popular project management tool that provides a visual representation of a project schedule. It is named after Henry Gantt, an American mechanical engineer and management consultant who developed the technique in the 1910s.
Gantt charts are used to plan, coordinate, and track tasks in a project. They consist of a horizontal timeline representing the total duration of the project, broken down into smaller intervals (days, weeks, months).
Each task or activity in the project is represented as a bar on the chart, with the length of the bar indicating the duration of the task and its position showing when the task is scheduled to start and finish. Dependencies between tasks can also be shown on the chart, indicating which tasks need to be completed before others can begin.
Gantt charts are valuable for project managers and teams as they provide a clear, visual overview of the project schedule, helping to identify potential bottlenecks, track progress, and communicate the project timeline to stakeholders.
What Is a Kanban Board?
A kanban board is a project management tool used to visualize and manage work, particularly in agile and lean methodologies. It is based on the principles of kanban, a Japanese scheduling system for just-in-time manufacturing.
A kanban board typically consists of columns representing different stages of a workflow, such as “To Do,” “In Progress,” “Review,” and “Done.” Tasks or work items are represented as cards that move across the board as they progress through the workflow stages.
Team members can see at a glance what work is in progress, what needs to be done next, and what has been completed. This visual representation helps to limit work in progress, identify bottlenecks, and improve the flow of work through the system.
Kanban boards are flexible and can be adapted to various workflows and projects. They are especially useful for teams that value visual management and want to optimize their work processes continuously.
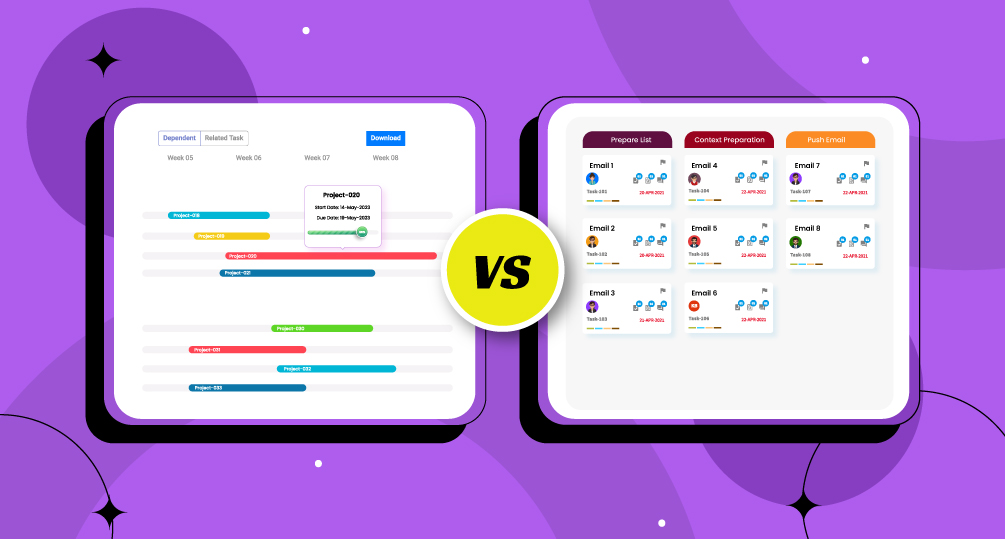
Gantt Chart vs. Kanban Board: Side-by-Side Comparison
Gantt charts and Kanban boards are two popular tools used for project management, each offering unique advantages based on the project’s nature and requirements. Gantt charts visualize tasks in a timeline format, showcasing start and end dates, task dependencies, and durations. They are well-suited for projects with clear start and end dates, providing a comprehensive overview of the project timeline and progress. In contrast, Kanban boards visualize tasks as cards in columns, representing stages of the workflow. They are ideal for projects with fluid timelines, emphasizing continuous flow and limiting work in progress (WIP).
Gantt charts excel at tracking task dependencies, making them valuable for understanding task sequences and project timelines. However, they are less flexible in accommodating changes, as adjusting tasks can impact the entire timeline. On the other hand, Kanban boards offer greater flexibility, allowing for easy addition, removal, and reordering of tasks to adapt to changing priorities. They focus on workflow efficiency and limiting WIP, making them suitable for Agile and Lean environments where continuous improvement is essential.
Gantt charts are best suited for projects with fixed timelines and dependencies, providing a detailed view of project progress. Meanwhile, Kanban boards are more suitable for projects with evolving requirements, offering flexibility and adaptability to optimize workflow and manage tasks effectively.
YoroProject Has Gantt Charts and Kanban Boards
YoroProject is a comprehensive project management software that offers a range of tools to help teams plan, execute, and track their projects effectively. One of the key features of YoroProject is its support for both Gantt charts and Kanban boards, providing users with flexibility in how they manage their projects.
Gantt charts in YoroProject allow users to create visual timelines of their projects, showing tasks, milestones, and dependencies. Users can easily create and schedule tasks, set durations, and establish dependencies between tasks. This provides a clear overview of the project timeline, allowing users to see how tasks are progressing and identify any potential delays or bottlenecks.

Kanban boards, on the other hand, help teams visualize their workflow and manage tasks in a more agile manner. Users can create columns representing different stages of the workflow (e.g., to-do, in progress, completed) and move tasks between columns as they progress. This allows teams to limit work in progress (WIP) and focus on completing tasks efficiently.

The combination of Gantt charts and Kanban boards in YoroProject provides users with a comprehensive set of tools for managing their projects. Whether users prefer a more traditional, timeline-based approach or a more agile development, workflow-based approach, YoroProject has the tools to support their needs.
Additionally, YoroProject offers other features such as task tracking, resource management, and reporting, making it a versatile and powerful tool for project management.