


Table of Contents
In the fast-paced world of project management, the ability to effectively manage risks is crucial for ensuring project success. One tool that has proven to be invaluable in this regard is the Gantt chart. Originally developed by Henry Gantt in the 1910s, this visual representation of a project schedule has evolved into a powerful tool for not only scheduling tasks but also for managing risks.
Understanding Gantt Charts
Before diving into how Gantt charts can enhance risk management, let’s first understand what they are. A Gantt chart is a bar chart that represents a project schedule. Each bar represents a task, with the length of the bar indicating the duration of the task. The bars are positioned along a timeline, showing when each task is scheduled to start and finish. Dependencies between tasks are also shown, indicating which tasks must be completed before others can begin.
How Gantt Charts Enhance Risk Management
- Visibility: One of the key benefits of Gantt charts is their ability to provide a visual representation of the project schedule. This visibility allows project managers to easily identify potential risks, such as tasks that are behind schedule or dependencies that are not being met. By having this information readily available, project managers can take proactive measures to address these risks before they become larger issues.
- Resource Allocation: Gantt charts also help with resource allocation, showing which resources are assigned to which tasks and when. This information is essential for managing risks related to resource constraints. For example, if a critical task is at risk of being delayed due to resource shortages, project managers can quickly identify this and take steps to reallocate resources or adjust the schedule to mitigate the risk.
- Dependencies Management: Another way Gantt charts enhance risk management is by highlighting task dependencies. By understanding the dependencies between tasks, project managers can identify potential risks related to these dependencies. For example, if a task that is critical to the project’s timeline has a dependency on an external vendor, project managers can proactively manage this risk by ensuring clear communication with the vendor and having contingency plans in place in case of delays.
- Scenario Planning: Gantt charts also allow for scenario planning, which is essential for risk management. Project managers can create different scenarios based on various risk factors, such as resource shortages or unexpected delays, and see how these scenarios would impact the project schedule. This helps project managers develop contingency plans and make informed decisions to mitigate risks.
Gantt charts are a valuable tool for enhancing risk management in project management. By providing visibility into the project schedule, helping with resource allocation, highlighting task dependencies, and enabling scenario planning, Gantt charts enable project managers to proactively identify and mitigate risks, ultimately leading to more successful project outcomes.
How Yoroproject's Gantt chart software helps for enhancing risk management
Yoroproject’s Gantt chart software is a powerful tool that can significantly enhance risk management practices within project management. Here are some key ways in which Yoroproject’s Gantt chart software helps in this regard:
Visual Representation of Project Timelines:
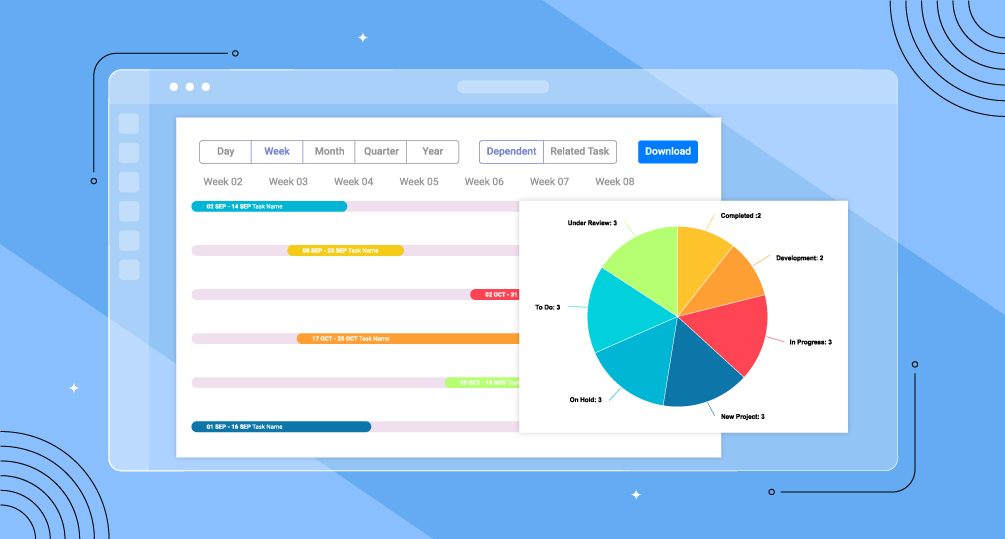
Yoroproject’s Gantt chart software provides a visual representation of project timelines, including start and finish dates for each task. This visual representation makes it easier for project managers to identify potential risks related to project delays and take proactive measures to mitigate them.
Identification of Dependencies and Critical Path:
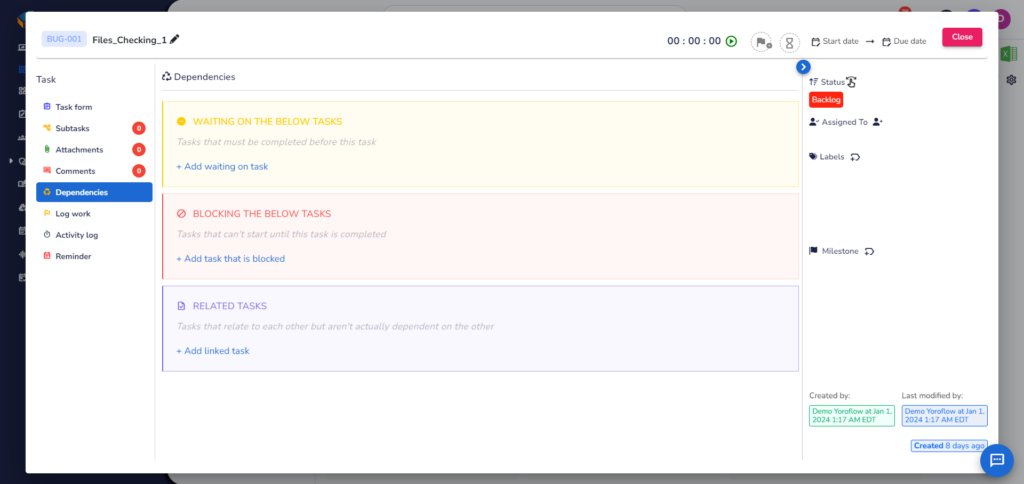
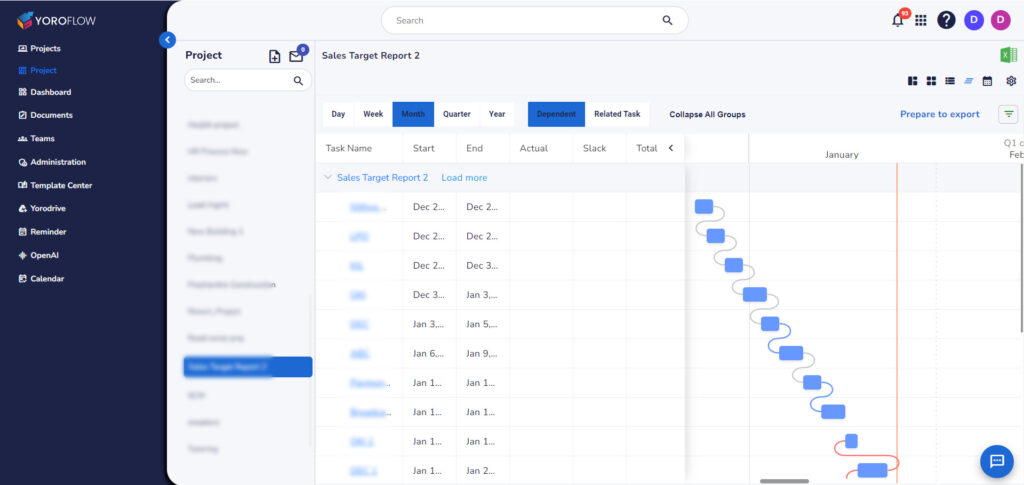
Yoroproject’s Gantt chart software helps in identifying dependencies between different tasks and determining the critical path for the project. By understanding these dependencies, project managers can better assess the impact of potential risks and prioritize tasks accordingly.
Resource Allocation and Management:
Yoroproject’s Gantt chart software allows project managers to allocate resources efficiently by providing a clear overview of resource availability and allocation. This helps in ensuring that resources are used effectively, minimizing the impact of potential risks related to resource shortages.
Facilitation of Communication and Collaboration:
Yoroproject’s Gantt chart software facilitates communication and collaboration among team members by providing a centralized platform where project timelines and progress can be viewed. This transparency fosters collaboration and ensures that all team members are aware of project risks and mitigation strategies.
Proactive Risk Management:
Perhaps the most significant benefit of Yoroproject’s Gantt chart software is its ability to enable proactive risk management. By providing a clear visualization of project timelines, dependencies, and resource allocation, project managers can identify potential risks early on and develop mitigation strategies to address them before they escalate.
In conclusion, Yoroproject’s Gantt chart software is a valuable tool for enhancing risk management practices within project management. By providing a visual representation of project timelines, identifying dependencies and critical paths, aiding in resource allocation and management, facilitating communication and collaboration, and enabling proactive risk management, Yoroproject’s Gantt chart software helps ensure that projects are completed successfully, on time, and within budget.