


Table of Contents
Have you ever wondered why managers and business owners rely heavily on dashboard reporting for collecting KPIs and company insights? The answer lies in the use of various types of Admin dashboard widgets, which make these dashboards both reliable and impactful.
These widgets are essential components of any dashboard, offering users an exceptional experience. They can provide valuable insights through charts, graphs, timelines, or other means, covering a wide range of information.
To help you understand the importance of these widgets, we’ve compiled a list of the most useful types. At Yoroflow, we specialize in delivering high-quality dashboard templates, which combine appealing UI designs, useful widgets, and well-structured layouts.
Drawing on the expertise and research of our developers and designers, we’ve curated this list to showcase the power of these widgets. So, without further ado, let’s dive in!
10+ Types of Must-Have Dashboard Widgets
Dashboard widgets are essential components of any dashboard design. They provide users with quick access to important information and help visualize data in a meaningful way. In this blog post, we’ll explore 10+ types of dashboard widgets that are must-haves for any dashboard UI.
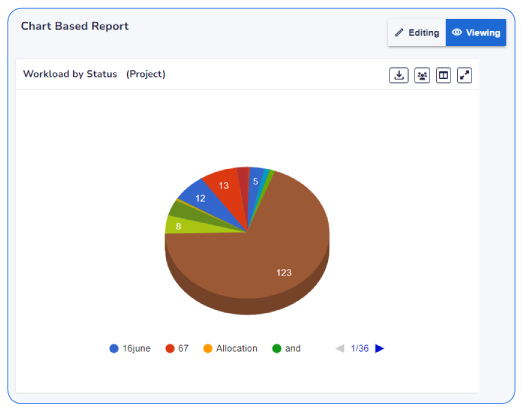
- Chart Widgets: Charts are a popular way to visualize data. They can include bar charts, line charts, pie charts, and more. Chart widgets are perfect for displaying project reports, form-based reports, and other types of data.
- Metric Widgets: Metric widgets display key performance indicators (KPIs) such as revenue, sales, or customer satisfaction. They provide a quick overview of the current status of a project or business.
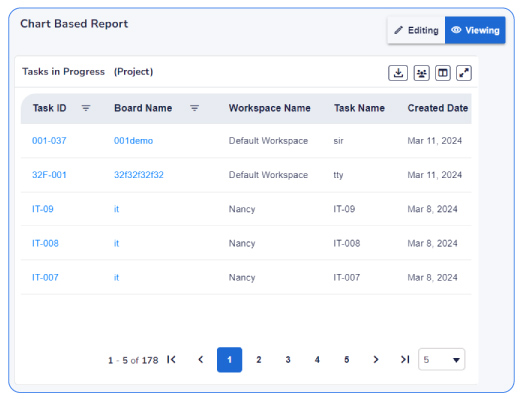
- Table Widgets: Table widgets are used to display tabular data. They are great for displaying detailed information and can be customized to show specific data fields.
- Image Widgets: Image widgets are used to display images or logos. They can be used to add visual interest to the dashboard or to display relevant images related to the data.
- Progress Widgets: Progress widgets are used to display the progress of a project or task. They can include progress bars, completion percentages, or countdown timers.
- Calendar Widgets: Calendar widgets are used to display a calendar view. They can be used to show important dates, deadlines, or upcoming events.
- Map Widgets: Map widgets are used to display geographic data. They can be used to visualize sales data by region or to display the location of project sites.
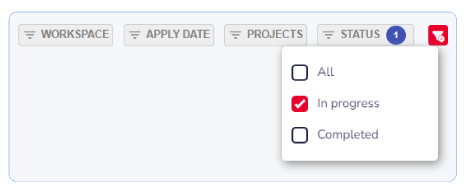
- Filter Widgets: Filter widgets are used to filter data displayed on the dashboard. They can be used to customize the data shown based on user preferences.
- Notification Widgets: Notification widgets are used to display alerts or notifications. They can be used to notify users of important events or changes in data.
Advantages of Having Widgets in the Dashboard
Widgets play a crucial role in enhancing the functionality and user experience of a dashboard. Here are some key advantages of having widgets in a dashboard:
- Customization: Widgets allow users to customize their dashboard according to their preferences and needs. They can choose which widgets to display, where to place them, and how to configure them, providing a personalized experience.
- Data Visualization: Widgets help in visualizing data in a meaningful way. They can include charts, graphs, maps, and other visual elements that make it easier for users to understand complex data sets and identify trends or patterns.
- Quick Access to Information: Widgets provide quick access to important information. Users can glance at the dashboard and immediately see the status of key performance indicators (KPIs), project progress, or any other relevant data.
- Real-time Updates: Widgets can display real-time data, allowing users to stay informed about the latest developments and make timely decisions.
- Interactivity: Some widgets are interactive, allowing users to explore data further by filtering, sorting, or drilling down into details. This interactivity enhances user engagement and facilitates data analysis.
- Efficient Monitoring: Widgets make it easy to monitor multiple data sources or metrics simultaneously. Users can track various aspects of their business or project in one consolidated view.
- Enhanced Communication: Widgets can be used to communicate information effectively. For example, a widget displaying a project timeline can help team members understand the project schedule at a glance.
- Improved Productivity: By providing easy access to relevant information, widgets can help users make informed decisions quickly, leading to improved productivity.
Dashboard widgets are essential for creating an effective dashboard design. By including a variety of widgets such as charts, tables, text, and images, you can create a dashboard that provides users with the information they need in a clear and concise manner.
Dashboard Widgets in Yoroflow
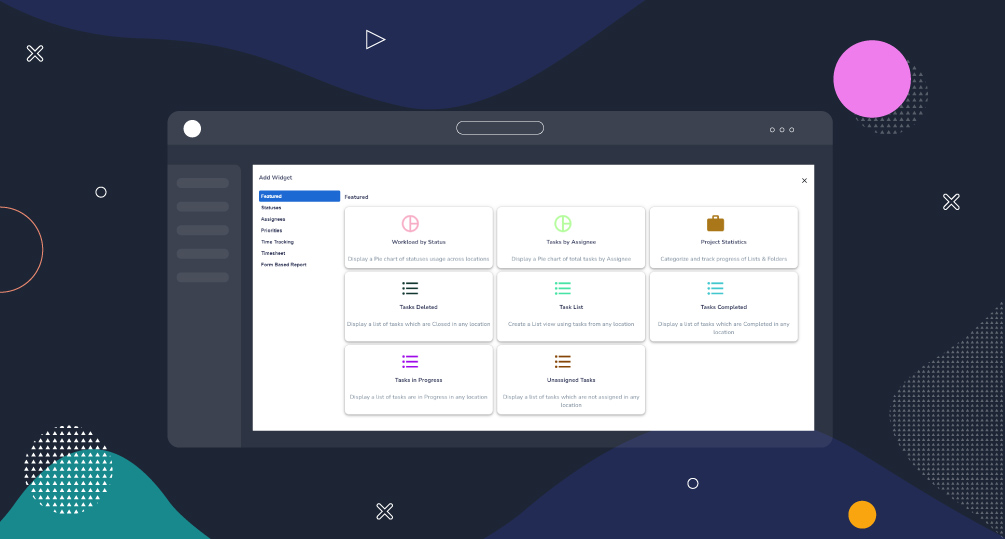
Yoroflow offers a diverse range of widgets that cater to various needs, ensuring users can effectively manage their workflows and processes. These widgets are designed to be versatile, allowing users to either utilize them as they are or create new ones tailored to their specific requirements.
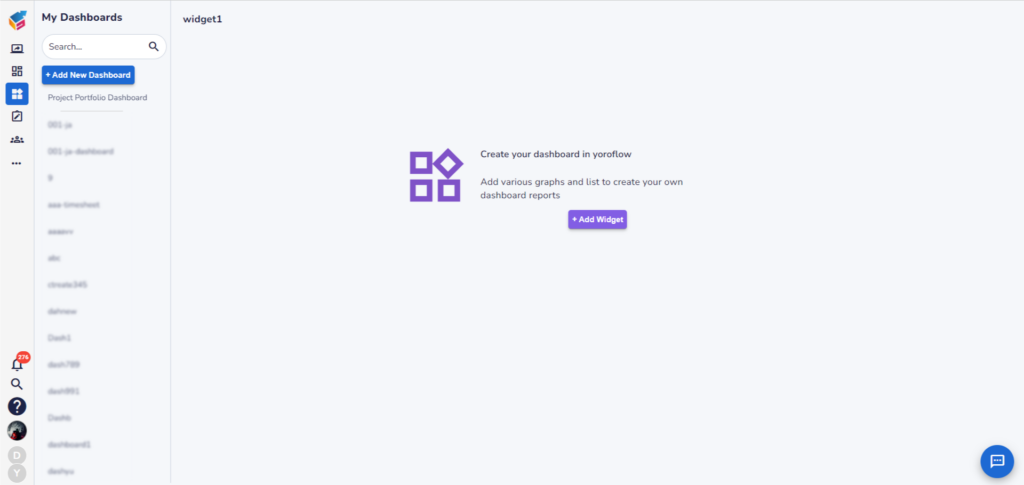
The flexibility of Yoroflow’s widgets enables users to customize their workflows and dashboards to suit their unique business processes. Whether you need to visualize data, track progress, or streamline communication, Yoroflow’s widgets offer the functionality and flexibility you need.
Furthermore, Yoroflow’s widget creation capabilities empower users to innovate and create new widgets that address specific business challenges. This feature allows users to tailor their workflows and dashboards to meet the evolving needs of their organization.
In conclusion, Yoroflow’s wide range of widgets and customizable options empower users to efficiently manage their workflows and processes, making it a valuable tool for businesses looking to optimize their operations.