Table of Contents
In today’s competitive business landscape, data-driven decision-making is crucial for success. Whether you’re a small business owner or a sales manager in a large corporation, having access to accurate and insightful sales analytics is essential for making informed decisions. One effective way to enhance your sales analytics is by using a simple sales report template. In this blog post, we’ll explore the benefits of using such a template and provide you with a step-by-step guide to create one for your business.

Why Use a Sales Report Template?
- Efficiency: Creating a sales report from scratch can be time-consuming. A pre-designed template streamlines the process, allowing you to focus on analyzing the data rather than formatting it.
- Consistency: Templates ensure that your reports have a uniform structure and format, making it easier for stakeholders to understand and compare data over time.
- Accuracy: By using a sales report template, you reduce the risk of errors in your reports, as key metrics and formulas are already in place.
- Customization: While templates provide a framework, they are often customizable to meet your specific needs and reporting requirements.
- Visual Appeal: Well-designed templates can make your reports visually appealing, making it easier for stakeholders to digest complex information.
Creating a Simple Sales Report Template
Follow these steps to create a straightforward sales report template that will help you improve your sales analytics:
Step 1: Define Your Objectives
Before you start designing your template, clarify what you want to achieve with your sales reports. Determine which key performance indicators (KPIs) are most important for your business, such as revenue, sales volume, conversion rates, or customer acquisition costs.
Step 2: Choose a Reporting Tool
Select a tool or software that suits your needs. Excel, Google Sheets, or specialized reporting software like Tableau or Power BI are popular options. Ensure the tool or template allows for easy data import and manipulation.
Step 3: Create a Framework
Design the structure of your template. Consider including sections like:
- Header: Company logo, report title, and date.
- Executive Summary: A brief overview of key findings.
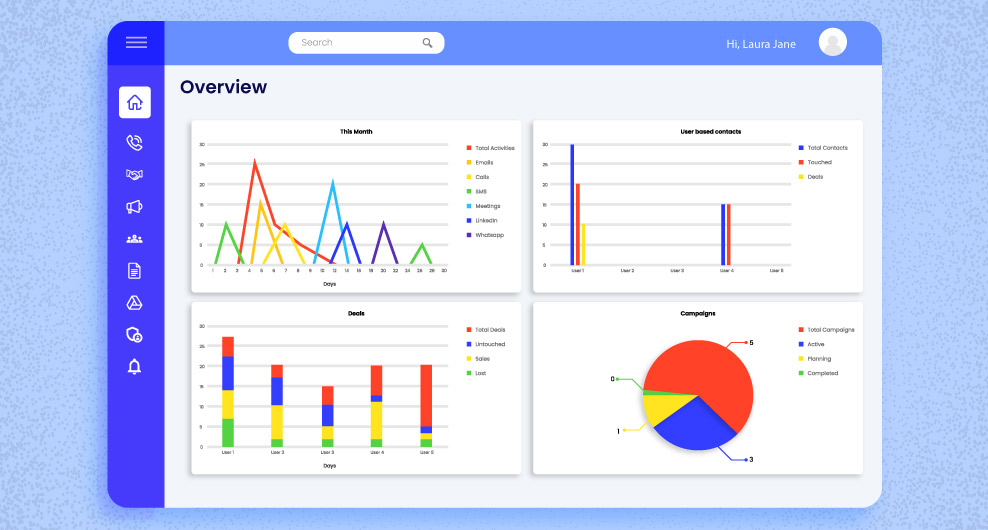
- Sales Performance: Graphs or charts showing revenue, sales by product, region, or channel.
- KPIs: Tables or graphs displaying essential metrics.
- Trends and Insights: A section for analyzing trends, identifying strengths, weaknesses, opportunities, and threats.
- Recommendations: Suggestions for improvements or actions based on the data.
Step 4: Data Input and Calculation
Set up data input fields and formulas for automatic calculations. Depending on your chosen tool, you can use functions and pivot tables to simplify data processing.
Step 5: Data Visualization
Incorporate charts, graphs, and visual elements to make your data more digestible. Pie charts, bar graphs, Gantt charts, line charts, and heatmaps are useful for representing different types of data.

Step 6: Formatting and Styling
Pay attention to formatting, font consistency, color schemes, and alignment to ensure a professional look. Consistency is key for readability.
Step 7: Test and Refine
Test your template with real data to ensure accuracy and functionality. Adjust as needed based on user feedback and evolving reporting requirements.
Step 8: Documentation
Document how to use the template, including data sources, refresh procedures, and any customization options. This ensures that your team can use it effectively.
Conclusion
Incorporating a simple sales report template into your sales process, including sales management and sales automation, can be a game-changer for your business. It streamlines the reporting process, enhances data accuracy, and provides valuable insights for making informed decisions.

By following the steps outlined in this blog, you can create a customized template that meets your specific needs and helps drive your sales strategy forward. Embrace the power of data and watch your sales soar.


